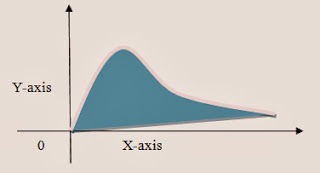
Skewness:
In
Statistics we have numerous distribution and every distribution has his own
graph and interpretation. Likewise, in skewness we use central tendency (Mean,
Mode, Median) and construe it accordingly. Therefore, skewness is a tool that assist
us to interpret central distribution or
central location through following three
ways:
Positively Skewed:
In
positively skewed, mean is always greater as compare to mode, median and mode
is always less then median. In mathematically we can write it as:
Mean > Median> Mode =
Mode< Median< Mean
Here
graph shows that the data is Positively skewed and has right tail.
Negatively Skewed:
In negatively skewed, mode is always greater as compare to mean and median, mean is
always less then median. In mathematically we can write it as:
Mean < Median < Mode = Mode
>Median > Mean
Here graph shows that the data is Natively skewed and has left tail.
Symmetric or Skewed:
In symmetric or
skewed, mean, mode and median are equal to each other and it has no tail.
Mean = Mode=Median
Here graph shows that the data is symmetric.


No comments:
Post a Comment